INFOGRAPHICS

Why are they important?

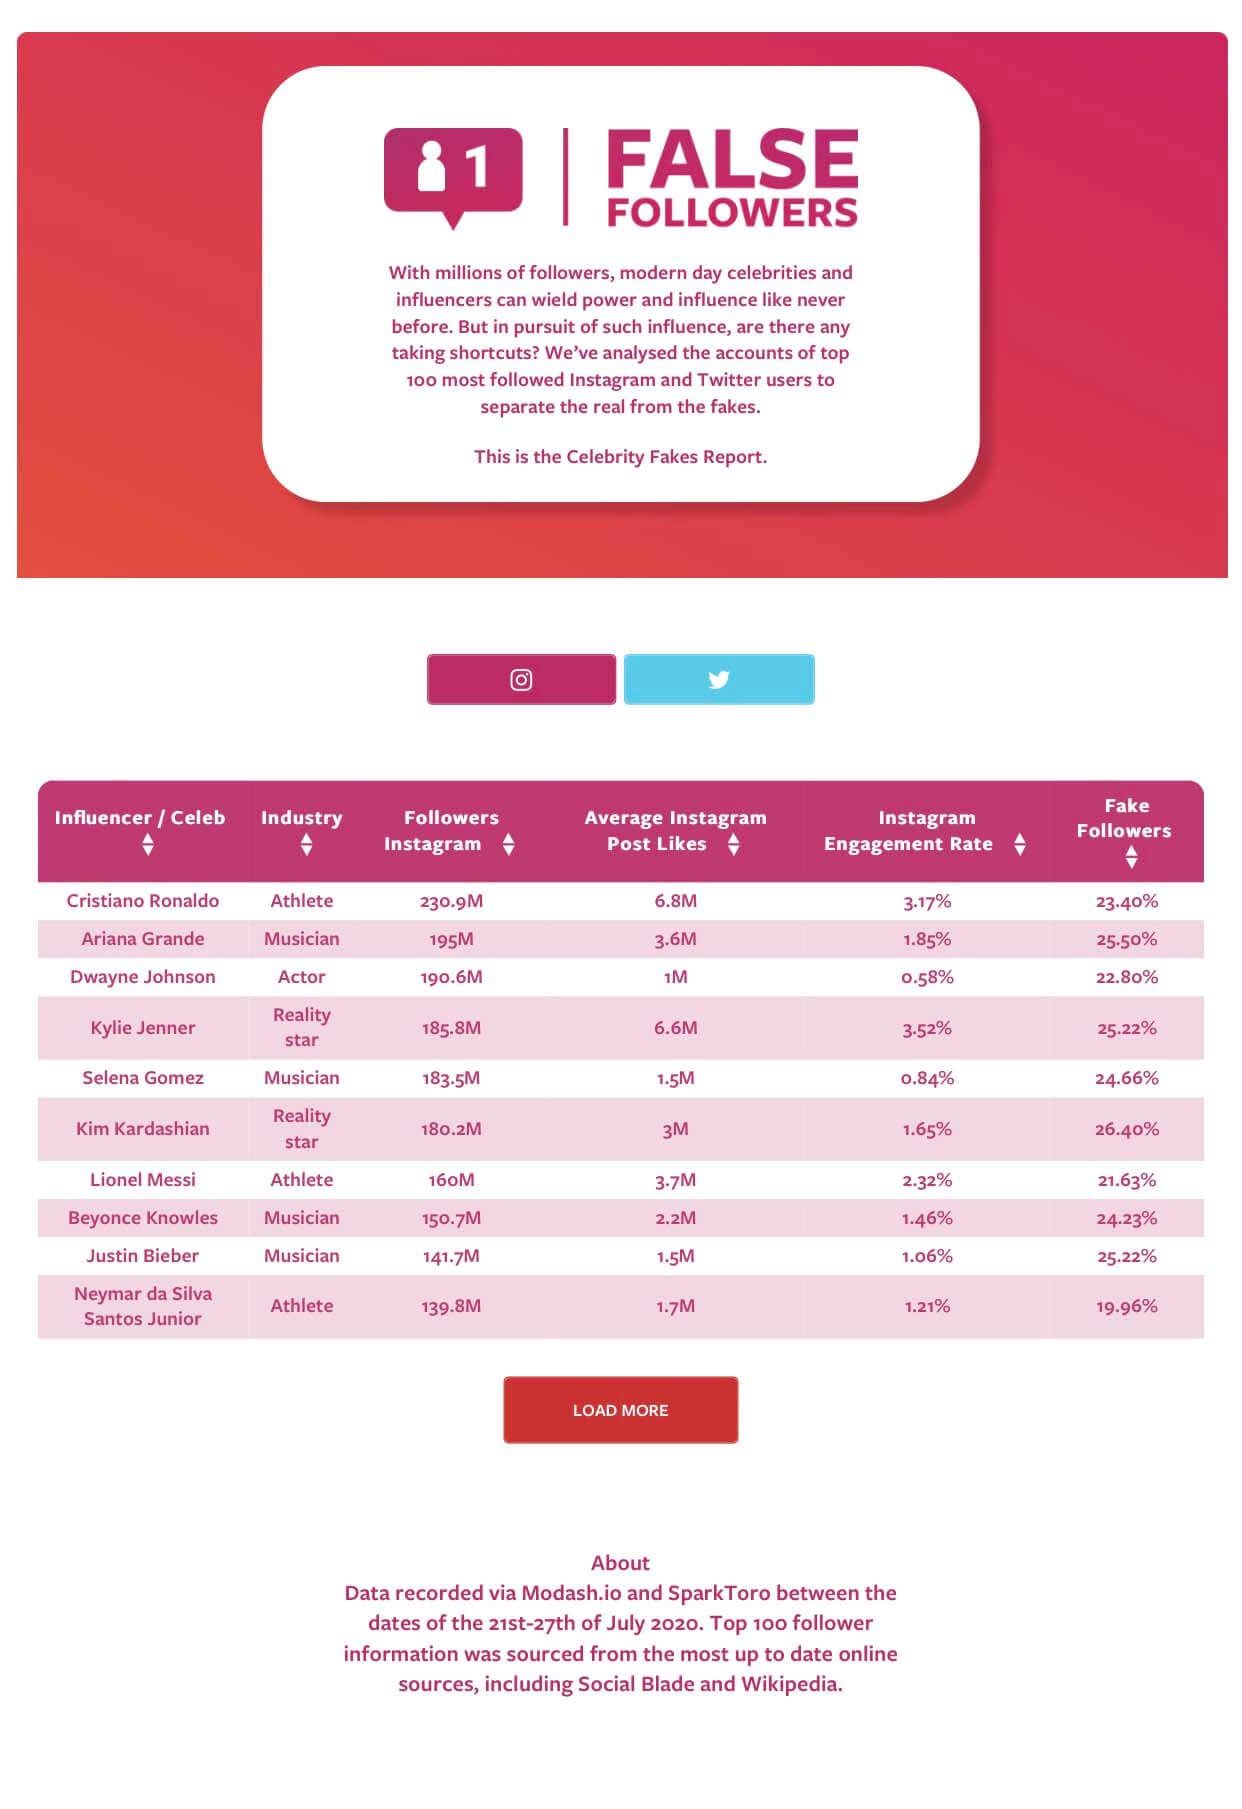
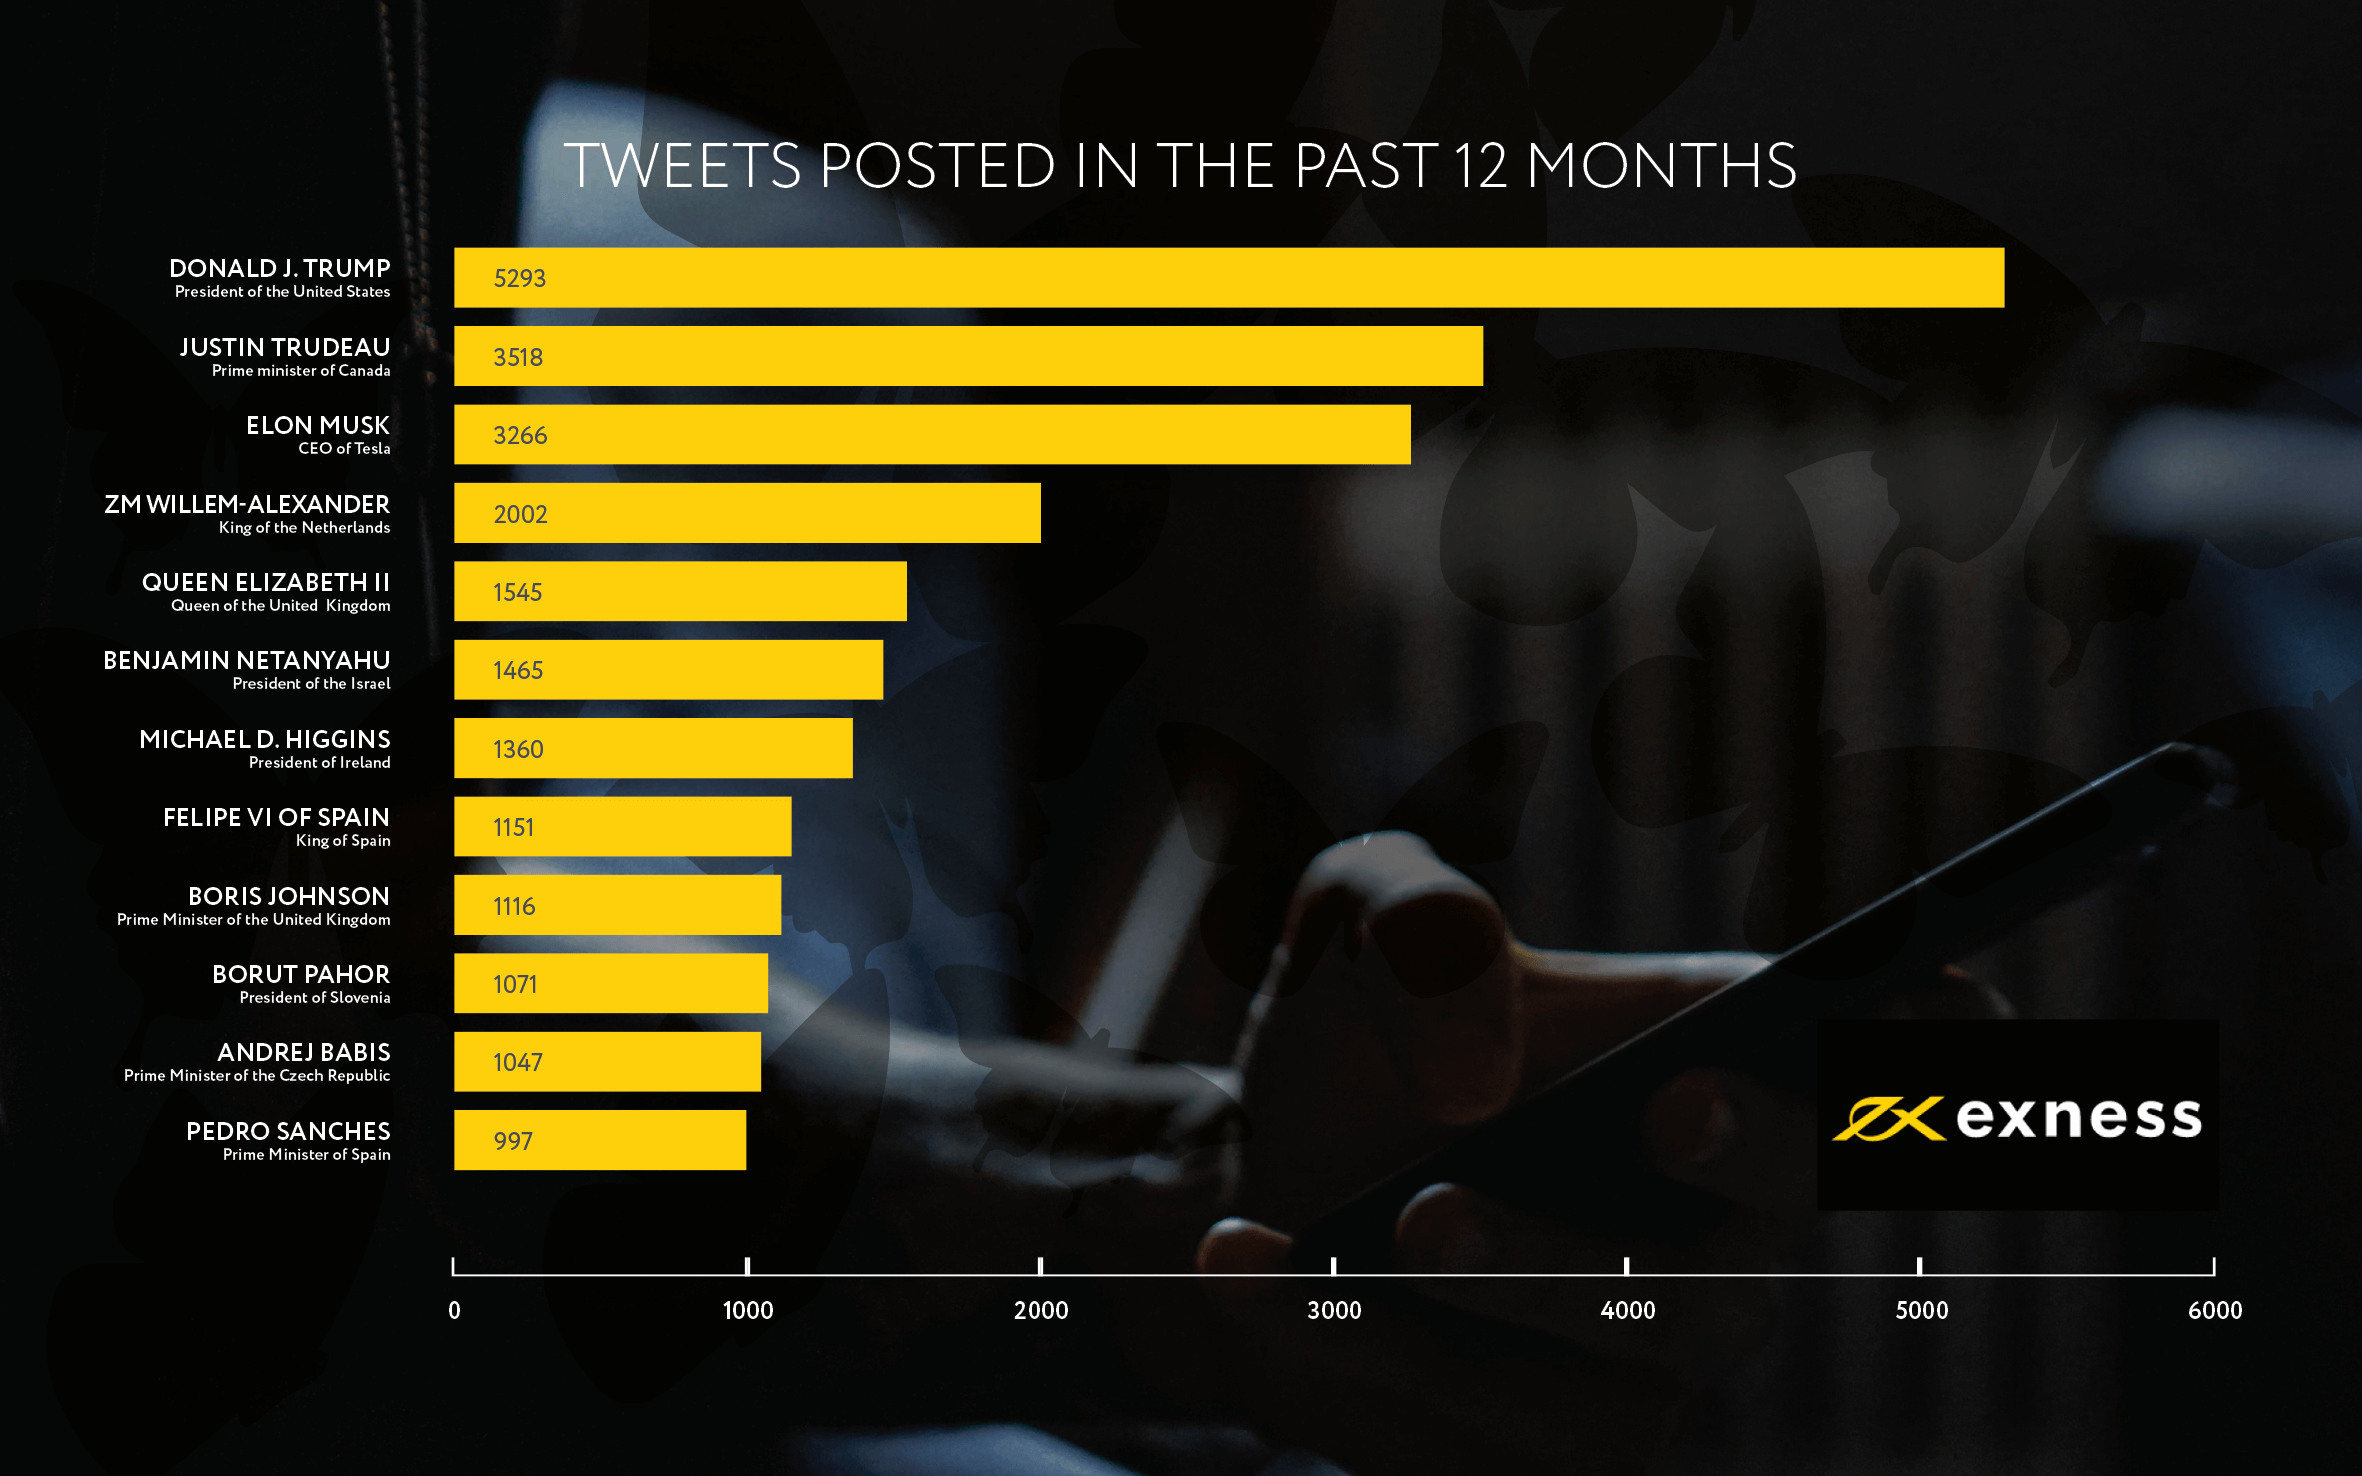
Graphical tables and information design is essential to convey facts and figures, they aide information retention and give interesting focal points to a body of text that captivates your audience and encourages them to read.

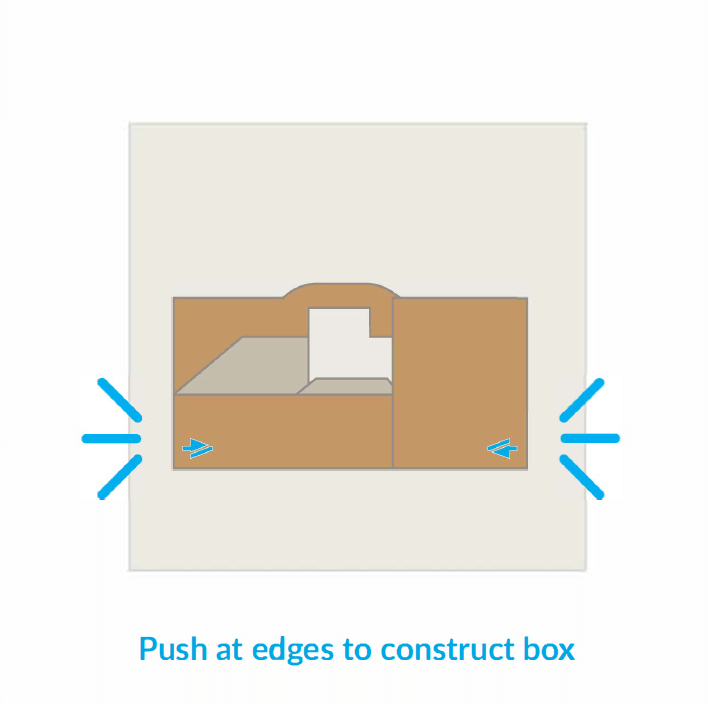
These could be designed in numerous different ways, Graphs, charts tables or simply icons and instructional pieces that instruct or inform the reader.


Below are just a few examples of infographics produced by Nathaniel brown.
Privacy Settings
We use cookies to enhance your experience while using our website. If you are using our Services via a browser you can restrict, block or remove cookies through your web browser settings. We also use content and scripts from third parties that may use tracking technologies. You can selectively provide your consent below to allow such third party embeds. For complete information about the cookies we use, data we collect and how we process them, please check our Privacy Policy
Youtube
Consent to display content from - Youtube
Vimeo
Consent to display content from - Vimeo
Google Maps
Consent to display content from - Google